μ-wheel
I am truly amazed by the abundance of the cancer genomics data and our current knowledge about the genes and the pathways they are involved in. With all these computational-friendly data sets out there, it is not surprising that we see a lot of tools, algorithms, and pipelines that analyze the data sets in their own way and suggest common mechanisms of tumor initiation or progression. Thanks to these recent tools and really clever studies, we now have a somewhat satisfactory explanation for many cancer types and how they occur.
Most of the explanations about tumor formation, however, focus on the genetic alterations of a limited set of genes. These well-known genes are commonly called cancer genes in the field and I will probably not be exaggerating if I say the community is obsessed with the cancer genes – like TP53 or EGFR.
It is, of course, easier to study common events due to the sample size and the statistical power that comes with it; but I believe, as a community, we are doing terrible when it comes to leverage all the knowledge we have accumulated over years about the common alterations to shed light on relatively rare alterations that might contribute to tumor initiation. There is a reason I am bringing this issue up: I believe there are ways we approach to this problem of rare alterations and exploring what their potential roles are. The way to attack this problem should be no different than the widely-known schema of problem solving: use prior knowledge to boost your statistical power to discover new associations.
And in this post, I will try to explain one way of doing this – a project we (Ed and I) call μ-wheel. For this project, we decided to approach the cancer genomics data from the metabolism perspective, a point of view that is often under-estimated. Sure, there are many well-studied areas in cancer metabolism, such as the Warburg Effect, but we still lack a general understanding of how and if alterations in metabolic genes have an effect on the cell behaviour.
To get an overview of alterations in metabolic genes, we decided to visualize the recurrent mutations in these genes in the hope for finding yet-another-hotspot – something like the recently emerged IDH story. For this, we:
- Downloaded the cross-cancer mutation data from the TCGA iniative (doi:10.7303/syn1710680.4).
- Using the Enzyme Commission Number database, classified all genes that have an EC number associated to it as metabolic.
- For all metabolic genes, extracted recurrent (n>1) mutations, that is mutations that are observed more than once and have a amino-acid-based coordinate to it.
- Grouped all mutations in multiple levels in order to look for enrichment in any categorical level.
- Created a web-based viewer, μ-wheel for better exploration of the data (doi:10.6084/m9.figshare.894458).
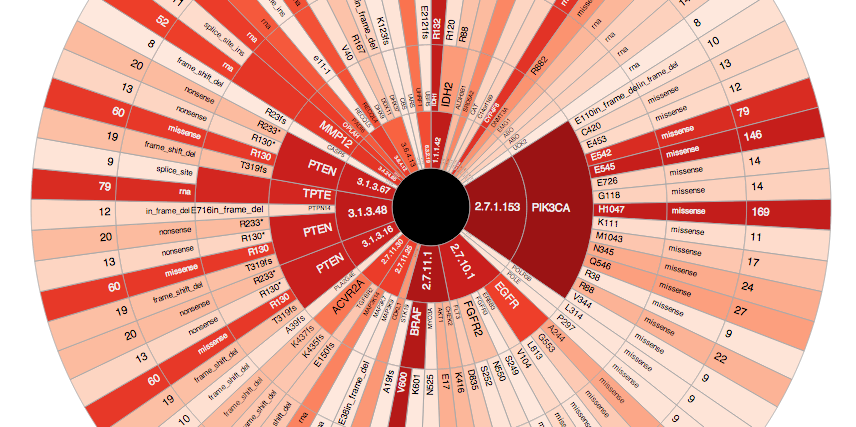
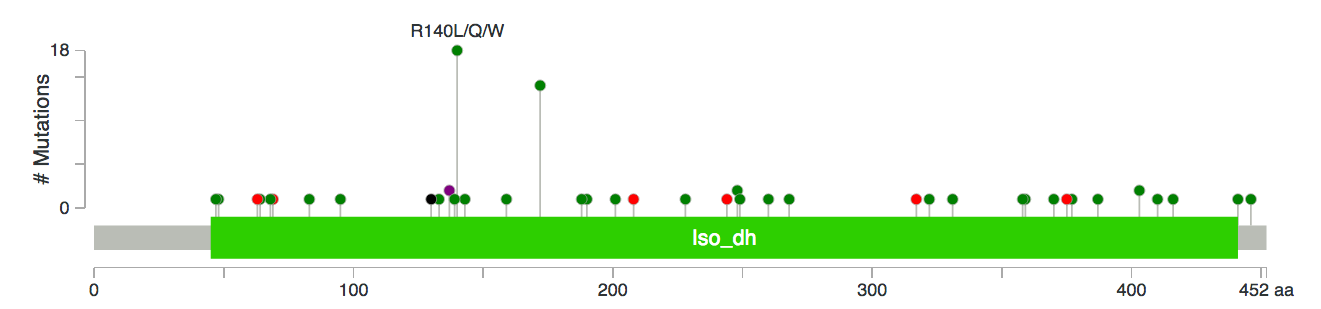
You can use the configuration options at the bottom of the page to customize the amount of information shown on the wheel. The shade of the red represents how many recurrent mutations there are in a category and for inner circles, the number of recurrent mutations in all lower levels are summed-up. Try moving your mouse over to different levels of rims and you will see that a pop-up will provide you with more information. Clicking on the enzyme name will take you to a KEGG Enzyme page where you can learn more about the functions of those genes and clicking on the gene name will take you to the cBioPortal where you can visualize the distribution of mutations in a better way, e.g.:
This visualization has some obvious problems: First, some genes (such as PTEN) show up in multiple EC categories, cluttering the view; Second, the colors of the higher categories do not directly suggest enrichment in that category as these numbers are now normalized for the number of locations/genes under a specific category. Third, some metabolic genes, in fact, are cancer genes according to the Sanger Cancer Gene Census (also have a look at these charts). These, especially the second one, are addressable problems, for example by applying a GSEA-like enrichment analysis.
Even in its current state, this visualization is really helpful in conveying the following message: if we are to group rare and common alterations by some known categorical system (prior knowledge), we might start to see enrichments that are not obvious when investigated one by one (boosting power). Try playing with the wheel, filter some mutation types out and change the recurrency levels; you will see interesting enzyme families starting to emerge from the whole mess. Yet, be aware that before conducting a proper statistical enrichment, it is hard to claim anything from this analysis.
But again, this is an on-going pet project and I am expecting to follow up on this soon. So stay tuned and feel free to comment or get in contact; I will love to hear your thoughts on this.