DepMap in the Upside Down: When Tumor Suppressors Reveal Hidden Vulnerabilities
People (including me) usually come to DepMap for the synthetic lethalities, the strongly selective dependencies, and the extremely negative gene effect scores (often CERES/Chronos < -1) that scream “this gene is essential for this cell line”; but I have recently found that there is an “Upside Down” view of the data set that is easy to miss.
This reversed view is anchored based on a handful of “normal-ish” retinal pigment epithelial (RPE) lines and the positive effect observed for some genes that have therapeutic potential to them.

The usual direction: negative gene effect
DepMap’s CRISPR gene effect scores are scaled so that a score of 0 corresponds roughly to a typical non-essential gene, while -1 corresponds to the median of common essential genes. More negative values indicate stronger loss of fitness upon knockout. Under the hood, these gene effect values come from pooled CRISPR screens combined with modeling and correction steps. CERES corrects for copy-number driven cutting toxicity, while Chronos models population dynamics to infer relative growth-rate effects over time.
This framing naturally focuses attention on genes whose loss is deleterious for a good reason (therapeutic target nomination); but, because of this, the positive side of the distribution often stays underexplored.
What does positive gene effect mean?
A positive gene effect means that cells lacking that gene tend to increase in abundance relative to controls over the course of the screen. In other words, the inferred growth rate of the knockout population is higher than the neutral reference.
There are several non-mutually exclusive reasons this can happen: the most straightforward is true proliferative advantage, where disrupting the gene removes a growth brake. Positive scores can also arise from assay-specific artifacts such as weak guide activity, batch effects, or modeling error. Finally, some effects are small on a per-division basis but accumulate over time in pooled competition assays.
Importantly, the idea that certain genes act as growth brakes whose loss yields positive selection is not speculative. Lenoir et al. previously formalized the concept of proliferation-suppressor genes (PSGs), defined explicitly as genes whose knockout leads to positive selection in CRISPR screens. They showed that many PSGs are well-known tumor suppressors, including TP53, CDKN1A, CHEK2, and TP53BP1, and that these signals are robust across analysis methods including CERES. Their headline example in AML demonstrates how PSG behavior can uncover pathway-specific liabilities, rather than simply cataloging growth brakes. This supports the idea that positive gene effects can be an organizing signal, not just a curiosity.
So the intuition is directionally correct. In a sufficiently normal-like context, knocking out a tumor suppressor can look like a growth advantage. The real questions are whether the context is appropriate and whether the signal is consistent enough to trust.
Enter the RPE lines: normal-ish with important caveats
The RPE lines highlighted here (RPE1SS48, RPE1SS77, RPE1SS6, RPE1SS119, RPE1SS51) are derived from hTERT RPE-1, a widely used non-cancerous retinal pigment epithelial model. According to DepMap and Cellosaurus metadata, these are hTERT-RPE1 derivatives used as part of a controlled panel. RPE1-SS48 and RPE1-SS77 are listed as control clones, while RPE1-SS6, SS51, and SS119 are stable aneuploid derivatives generated by transient treatment with the TTK inhibitor reversine, which induces chromosome missegregation and defined karyotypic changes.
This distinction matters. These are not primary, unmanipulated normal cells. They are telomerase-immortalized, and some are intentionally aneuploid. As a result, PSG-like signals in these lines may reflect RPE-specific, immortalized, or aneuploid biology rather than a universal normal-cell baseline.
At the same time, this context is useful precisely because it sits close to the boundary between normal and transformed, while remaining compatible with pooled CRISPR screening.
The Upside Down observation: positive in RPE enriches for tumor suppressors
The observation that PTEN and APC score positively in these RPE lines is consistent with prior PSG work. TP53 shows positive selection in TP53 wild-type backgrounds, and PTEN behaves similarly in PTEN wild-type contexts. A simple framing is that if an RPE subclone is wild-type for a growth brake gene, then knocking it out removes a constraint on proliferation or survival. In pooled assays, that relief can translate into a competitive advantage and a positive gene effect score. This is PSG logic applied to a small set of normal-ish reference lines.
Taking this idea seriously, we can rank genes by their average positive gene effect across the RPE subclones. When we do this, a familiar pattern emerges. Many of the top-scoring genes are well-known tumor suppressors or checkpoint regulators. Others are less characterized and may represent context-specific growth brakes or indirect effects.
The table below shows the top 50 such genes, sorted by average RPE score. Genes labeled “Known” are commonly described as tumor suppressors, growth brakes, or checkpoint regulators in at least one major context, often in a context-dependent manner. Genes labeled “Unknown” are not broadly established as tumor suppressors; the accompanying summaries should be read as hypotheses rather than claims.
Of course, a critical caveat is that these behaviors are observed in the RPE context. Some of these genes may not behave similarly in truly normal primary cells or in other epithelial lineages.
| gene | Average RPE score | Relavence to tumor supression | Why might depletion be advantageous in RPE (working hypothesis) |
|---|---|---|---|
| TP53 | 1.9852569 | Known | Removes a major DNA-damage or apoptosis checkpoint, letting stressed cells keep cycling. |
| NF2 | 1.7344470 | Known | Releases contact inhibition and Hippo pathway constraints (YAP and TAZ brake removal). |
| KIRREL1 | 1.2744843 | Unknown | Loss of an adhesion or structure-linked program may reduce contact-dependent growth restraint. |
| CDKN1A | 1.1971946 | Known | Removes p21-mediated cell-cycle arrest downstream of p53 and stress signaling. |
| AMOTL2 | 0.9274090 | Unknown | May weaken Hippo and YAP restraint or junctional growth control in epithelial-like cells. |
| PTEN | 0.9155450 | Known | Activates PI3K and AKT survival and proliferation signaling by removing a key negative regulator. |
| AHR | 0.7602595 | Unknown | Disrupts differentiation and xenobiotic-response programs that can restrain proliferation. |
| ARNT | 0.7455867 | Unknown | Perturbs hypoxia and xenobiotic transcriptional control, which could shift metabolism toward growth. |
| USP28 | 0.6885398 | Unknown | Alters stability of growth regulators and could reduce checkpoint enforcement in certain states. |
| DHX29 | 0.6442140 | Unknown | Translation-initiation stress rewiring could paradoxically favor fast-growing subpopulations. |
| AXIN1 | 0.6126982 | Known | Releases Wnt and beta-catenin control by removing a core negative regulator of Wnt signaling. |
| CHEK2 | 0.6098054 | Known | Weakens DNA damage checkpoints, allowing proliferation despite genomic stress. |
| TAOK1 | 0.6081043 | Unknown | May dampen stress-activated kinase signaling that otherwise slows cell-cycle progression. |
| TP53BP1 | 0.5889426 | Unknown | Reduced DNA repair checkpoint signaling can permit continued cycling after damage. |
| RNF146 | 0.5847380 | Unknown | Could shift Wnt, TNKS, and AXIN turnover dynamics toward proliferative signaling states. |
| FBXO42 | 0.5665235 | Unknown | E3-ligase rewiring may stabilize pro-growth proteins or destabilize growth brakes. |
| KEAP1 | 0.5653373 | Known | Activates NRF2 antioxidant and stress programs by removing NRF2 repression, aiding survival. |
| SAV1 | 0.5534215 | Known | Disables a Hippo pathway scaffold, potentially increasing YAP and TAZ-driven growth programs. |
| PTPN14 | 0.5439258 | Known | Weakens growth restraint via the Hippo and YAP axis and or adhesion-associated signaling. |
| LATS2 | 0.5289316 | Known | Disables a core Hippo kinase, enabling YAP and TAZ pro-growth transcriptional programs. |
| BICRA | 0.5115757 | Unknown | SWI and SNF remodeling shift could relieve chromatin constraints on proliferation programs. |
| IQGAP1 | 0.5109535 | Unknown | Cytoskeletal and adhesion signaling rewiring may reduce contact-dependent growth restraint. |
| KCTD5 | 0.5074179 | Unknown | Ubiquitin-adaptor effects could alter turnover of growth-inhibitory signaling components. |
| FRYL | 0.5062773 | Unknown | Loss may alter actin and junction organization, potentially reducing density-dependent arrest. |
| NRP1 | 0.5029067 | Unknown | Growth-factor and co-receptor signaling rewiring may shift pathways toward faster growth states. |
| PTPN12 | 0.4698385 | Known | Removes negative regulation on pro-growth RTK and SRC-family signaling in some contexts. |
| ZMAT3 | 0.4695220 | Known | Disrupts a p53-linked RNA regulation node that can enforce growth restraint. |
| PBRM1 | 0.4627803 | Known | Chromatin remodeling brake removal may relax transcriptional constraints on proliferation. |
| CNOT11 | 0.4569565 | Unknown | mRNA decay and translation control shifts could favor pro-growth transcript programs. |
| BRD9 | 0.4438428 | Unknown | Non-canonical BAF remodeling changes could relax differentiation constraints in RPE state. |
| R3HDM4 | 0.4420323 | Unknown | RNA metabolism changes could tilt expression toward proliferative isoforms and programs. |
| CCDC159 | 0.4351946 | Unknown | Poorly characterized; could reflect lineage-specific growth restraint circuitry. |
| PDCD10 | 0.4319345 | Unknown | Perturbs apoptosis and vascular signaling modules; may reduce stress-induced death. |
| FAM193A | 0.4306706 | Unknown | Poorly characterized; could mark an RPE-specific brake or assay-correlated effect. |
| APC | 0.4280347 | Known | Releases Wnt and beta-catenin signaling control by removing a core tumor suppressor brake. |
| BAG6 | 0.4258618 | Unknown | Alters proteostasis, immune presentation, and apoptosis balance, potentially improving survival. |
| HLA-DQB1 | 0.4235409 | Unknown | Likely not a true growth brake; could reflect expression and fitness model edge cases in vitro. |
| TRAF3 | 0.4225509 | Known | Loss can activate NF-kB survival signaling in certain cellular contexts. |
| CCDC6 | 0.4087856 | Known | Disrupts DNA damage response and growth restraint functions reported in multiple cancers. |
| CHD8 | 0.3933085 | Unknown | Chromatin regulation shift may de-repress pro-proliferative transcriptional programs. |
| BABAM1 | 0.3927088 | Unknown | DNA repair complex perturbation could weaken checkpoints that slow cycling after damage. |
| PPM1F | 0.3913650 | Unknown | Phosphatase loss may sustain kinase-driven pro-growth signaling states. |
| RB1 | 0.3900008 | Known | Removes G1 and S restriction point control, enabling unchecked cell-cycle progression. |
| ZNF853 | 0.3780378 | Unknown | Transcriptional regulation shift; could remove lineage-specific growth restraint. |
| ATXN3L | 0.3769404 | Unknown | Deubiquitinase-like effects may alter stability of growth-regulatory proteins. |
| CAND1 | 0.3744396 | Unknown | Cullin-RING ligase cycling changes could stabilize proteins that promote proliferation. |
| ARHGAP35 | 0.3673934 | Unknown | Rho GTPase signaling rewiring may alter adhesion and contact inhibition toward faster growth. |
| CASD1 | 0.3631760 | Unknown | Lipid and glycosylation changes might alter membrane signaling to favor growth. |
| NAPB | 0.3608647 | Unknown | Vesicle trafficking changes could shift receptor recycling and signaling toward proliferative states. |
| KDM6A | 0.3554378 | Known | Epigenetic brake removal (H3K27 demethylase context) can favor proliferation in some settings. |
From PSGs in RPE to activation lethality in cancer
The conceptual extension is straightforward. If loss of a gene confers a proliferative advantage in a normal-like context, then cancers that effectively live downstream of that loss may rely on compensatory pathways to survive the resulting rewired state. Those compensatory mechanisms can become druggable dependencies.
This is the mirror image of synthetic lethality. Instead of two losses killing the cell, removal of a brake pushes the system into a stressed configuration that requires new support.
Operationally, this suggests a filter strategy that starts with genes that are positive in RPE, removes obvious confounders such as immune-lineage artifacts or low-quality screen signals, requires near-neutral behavior across solid tumor lines on average, and then focuses on genes that show strong dependency in a subset of cancer lines. In other words, the target is not the proliferation suppressor itself, but the load-bearing dependencies that emerge downstream. Below is a table that lists genes that meet these criteria:
| Gene | Average RPE score | Average score across solid lines | Number of dependent lines | Heme or myeloid bias |
|---|---|---|---|---|
| FBXO42 | 0.57 | -0.16 | 1 | No |
| KEAP1 | 0.57 | -0.15 | 13 | No |
| TSC2 | 0.33 | -0.05 | 1 | Yes |
| RBM5 | 0.33 | -0.20 | 4 | No |
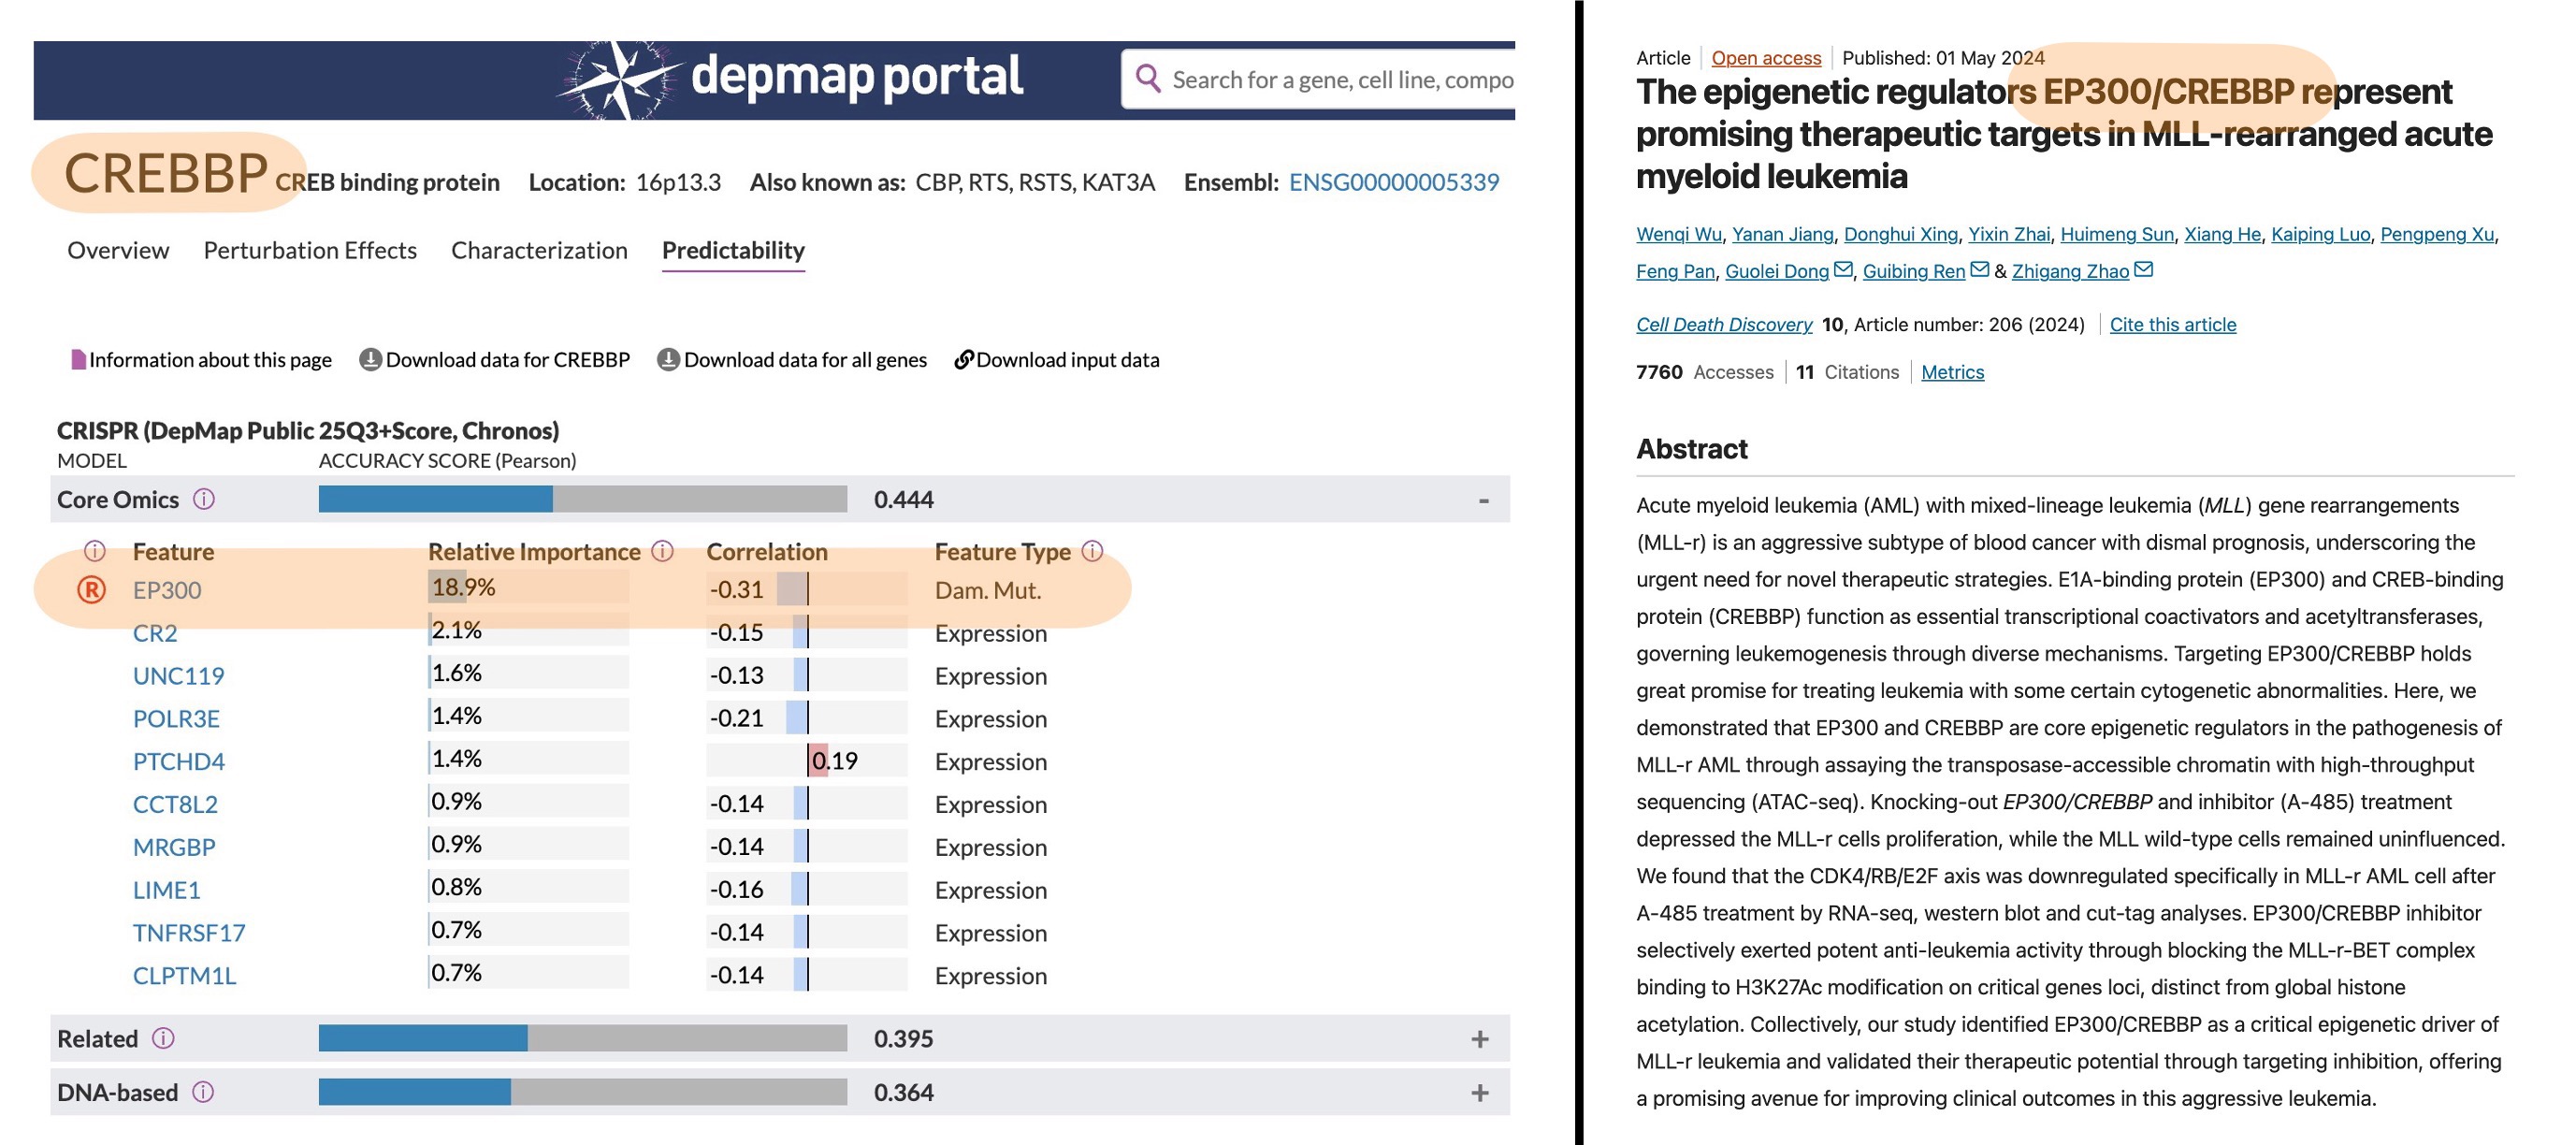
| CREBBP | 0.32 | -0.11 | 10 | No |
| AGPAT5 | 0.28 | 0.08 | 1 | No |
| SMARCA4 | 0.28 | -0.35 | 3 | No |
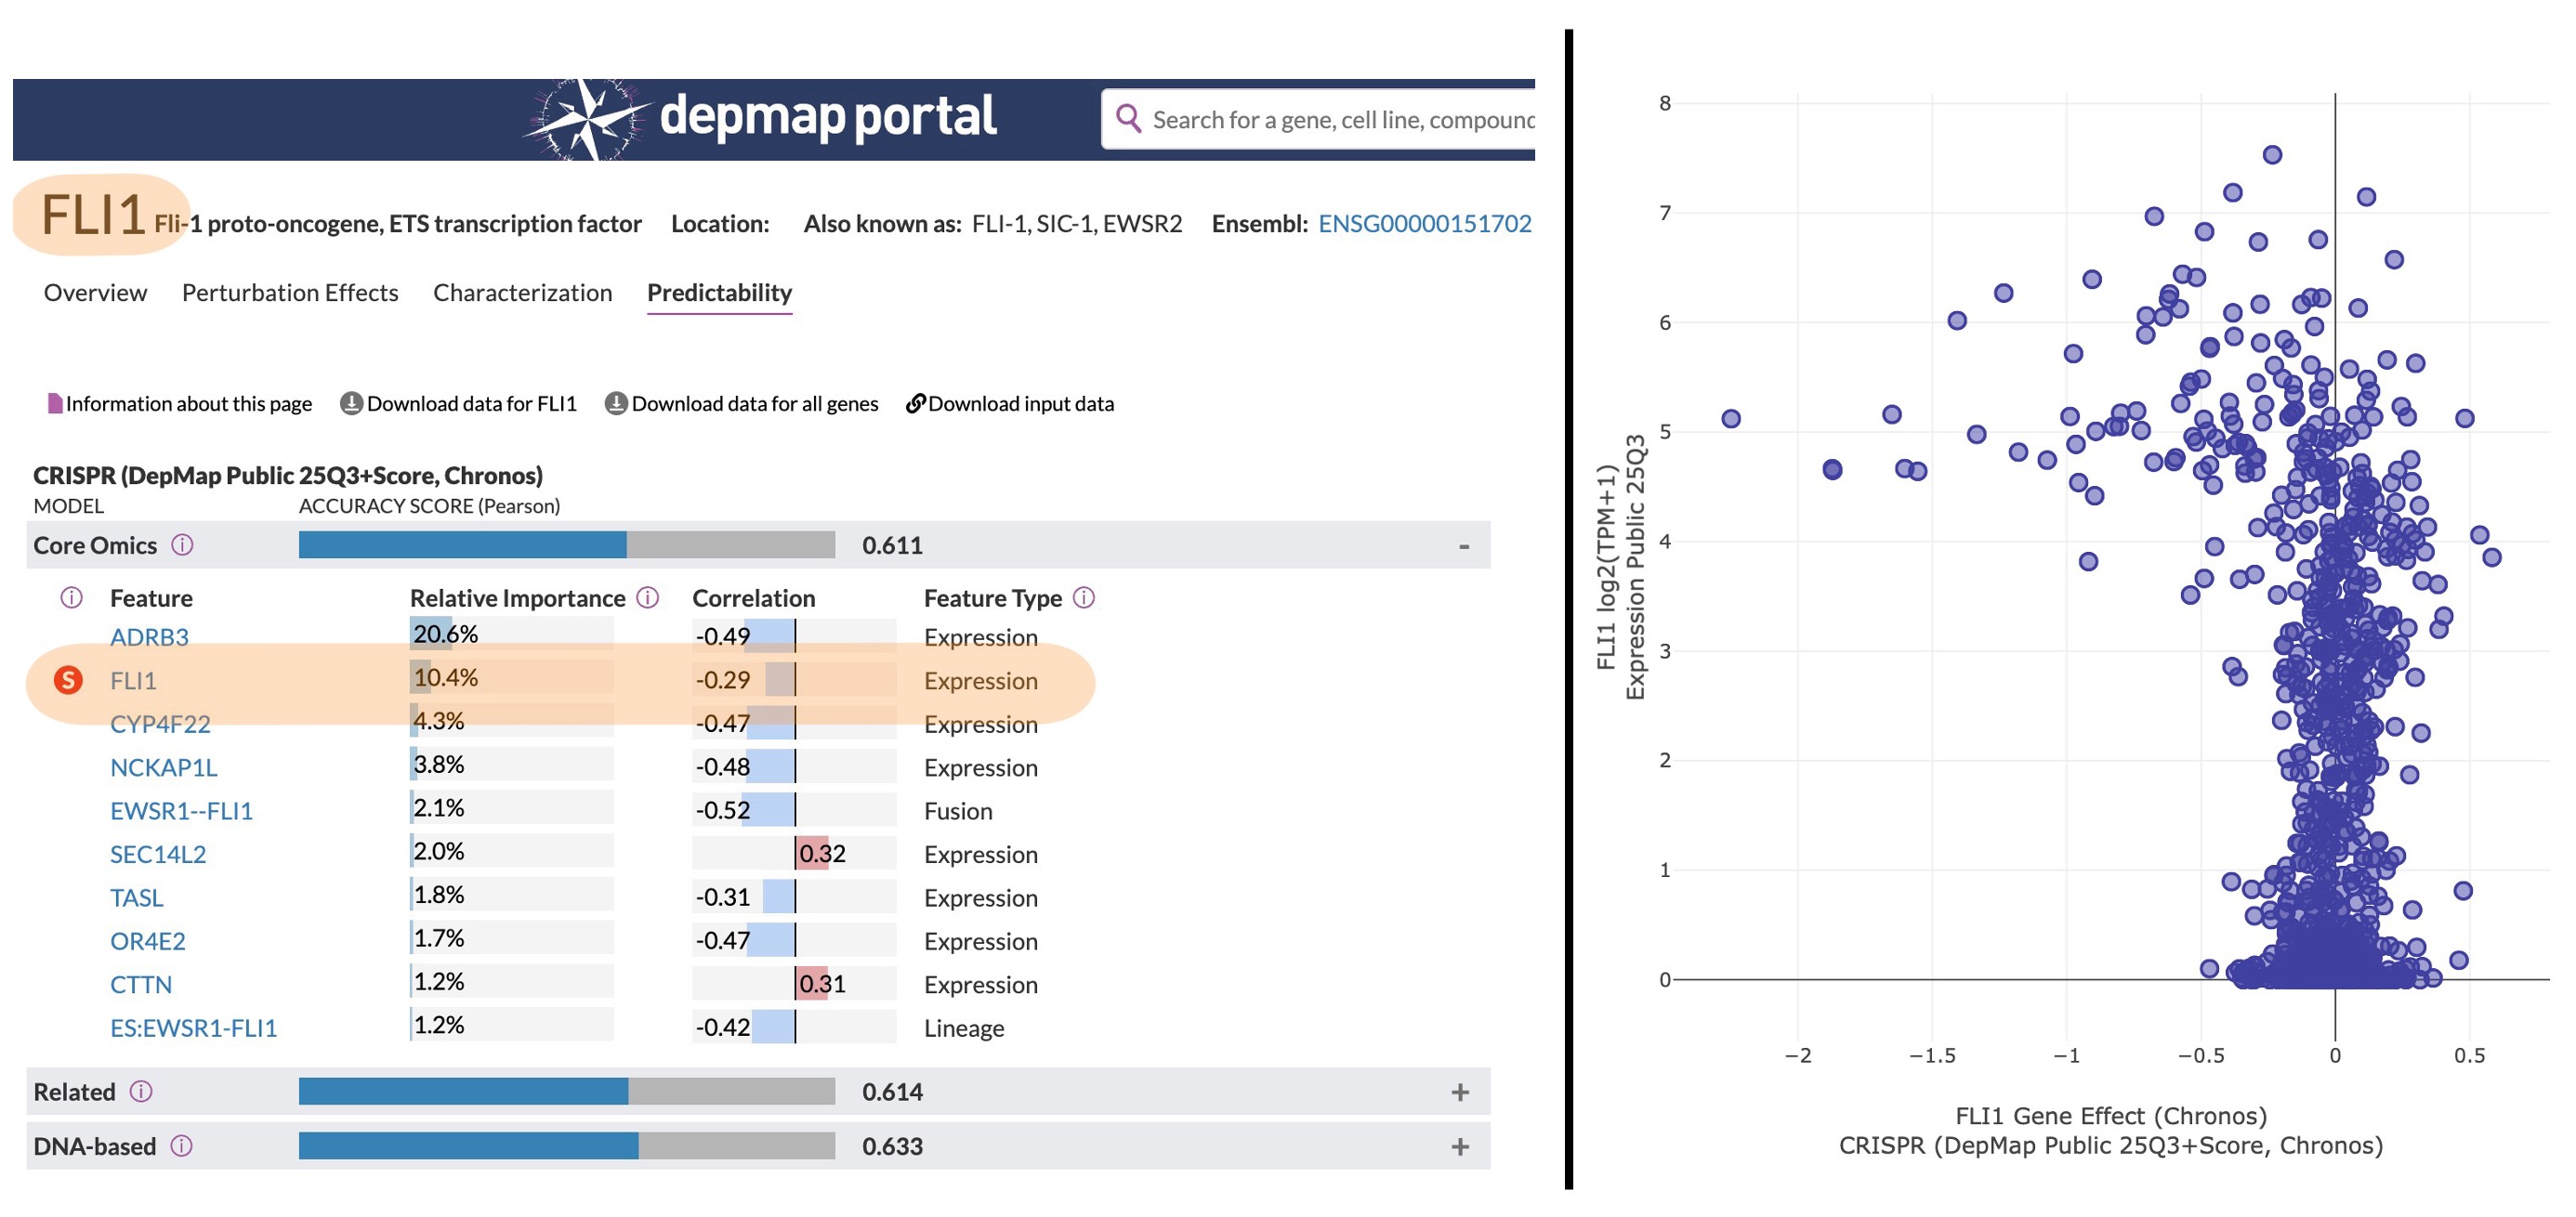
| FLI1 | 0.25 | -0.04 | 8 | Yes |
| EP300 | 0.25 | -0.26 | 6 | Yes |
| CAB39 | 0.25 | -0.18 | 2 | Yes |
| CBFB | 0.23 | -0.15 | 5 | Yes |
| LARS2 | 0.21 | -0.48 | 11 | No |
| MYBL1 | 0.20 | 0.10 | 1 | No |
Among these, there are a few familiar faces – for example, the CREBBP and EP300 activator pair:
and some trivial ones – for example, FLI1 overexpression creating a vulnerability for FLI1 depletion:
When you exlude the lymph- or myeloid-lineage specific vulnerabilities, the list gets even shorter and it gets easier to explore the profiles manually to see if there are interesting stories behind those. While doing that, RBM5 caught my eye because it has a very interesting DepMap profile (i.e. enrichment of a specific lineage and a related feature that strongly correlates with the dependency):
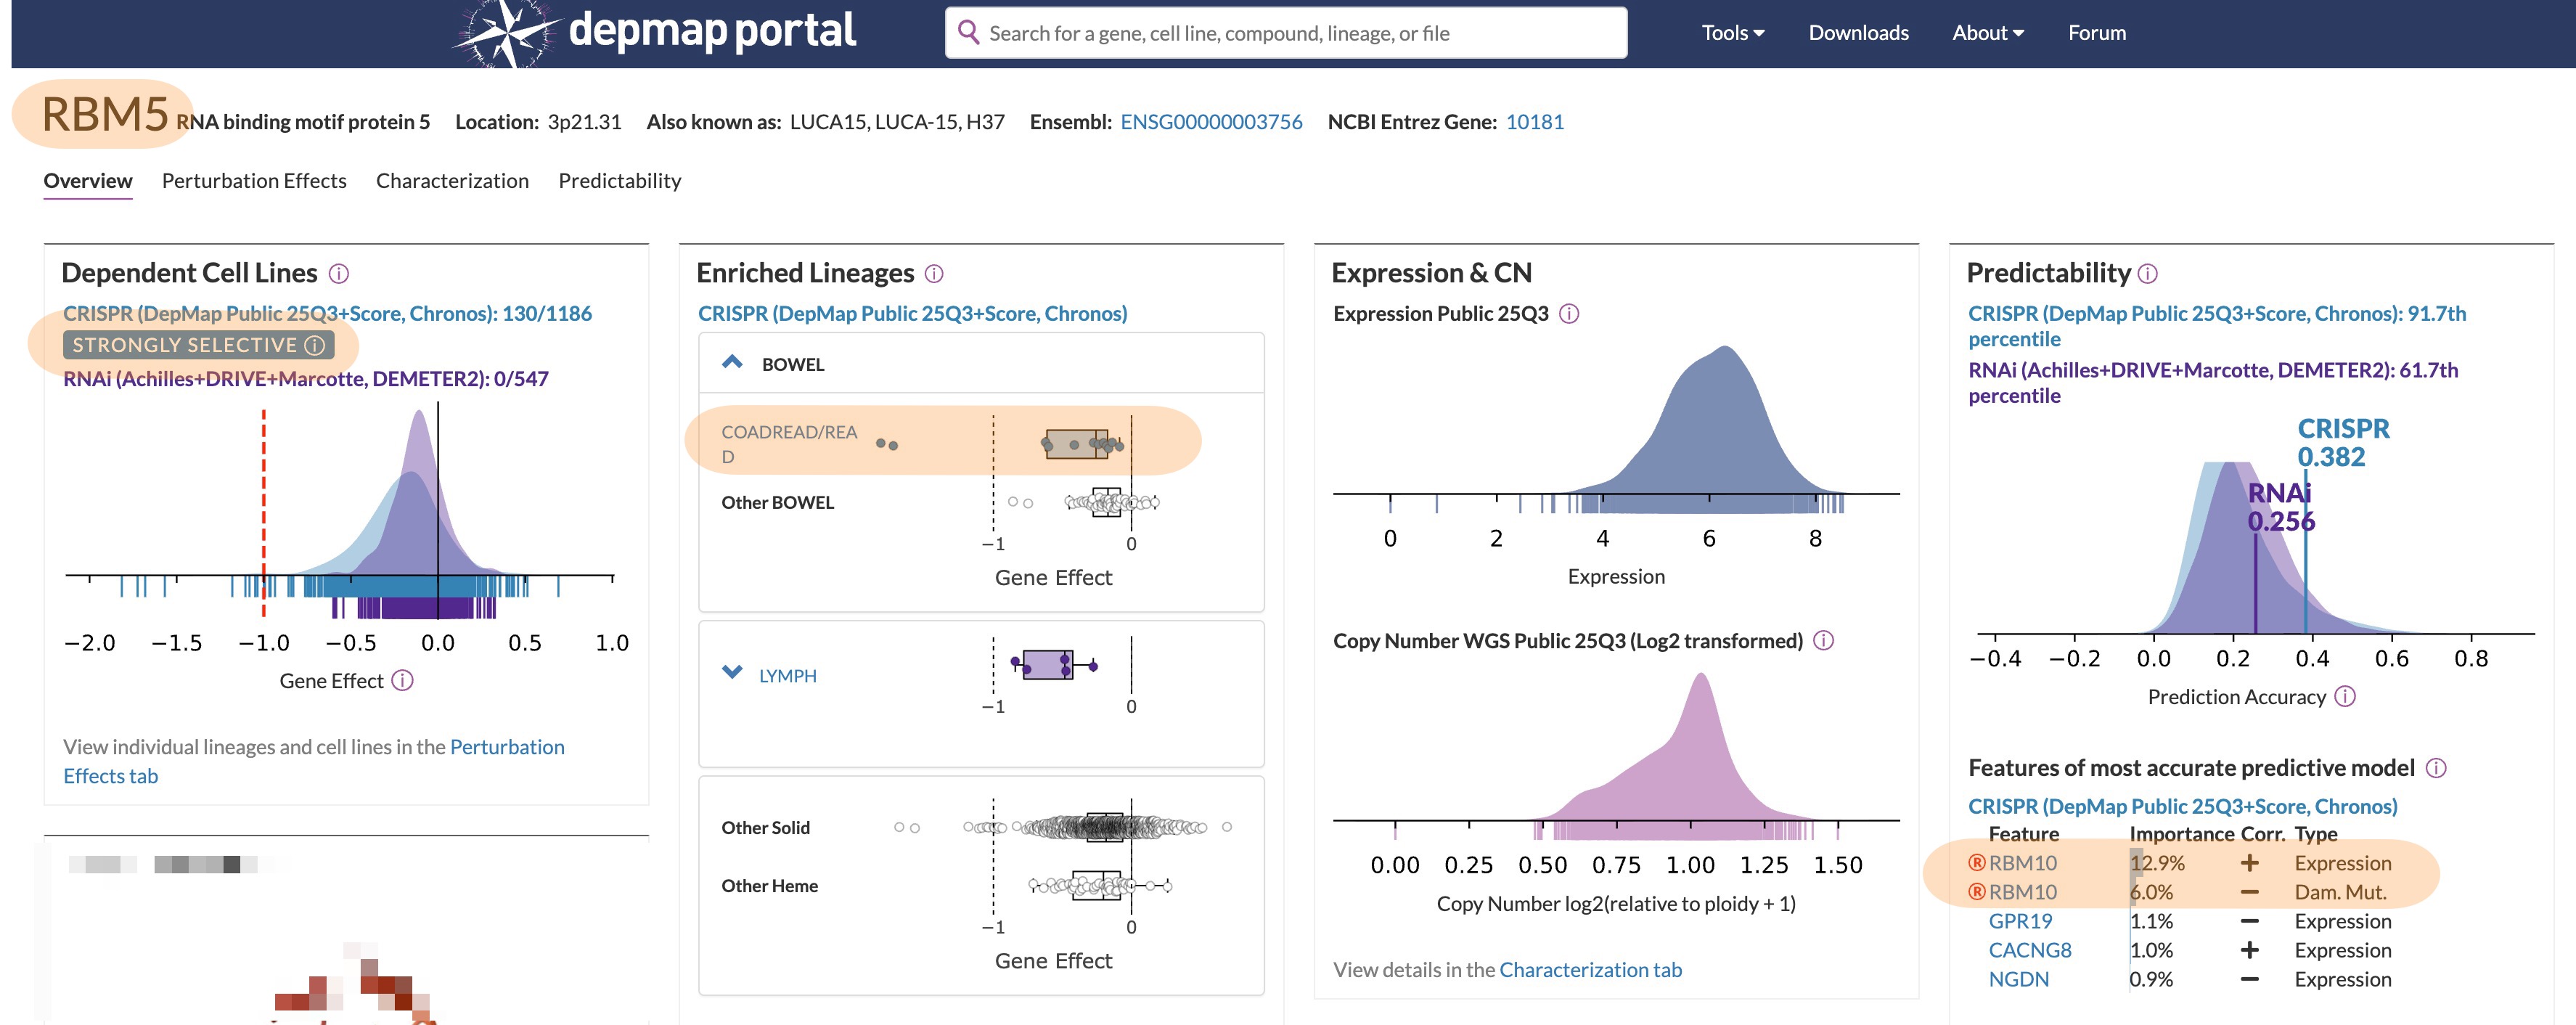
Power play between RBM5 and RBM10
Based on the DepMap profile, in RBM10-loss cell lines, RBM5 appears to function as a load-bearing compensator. At first glance, this might suggest a straightforward synthetic lethality, given that both genes encode RNA-binding proteins and share partially overlapping regulatory space. However, the data and the broader context argue for something slightly different.
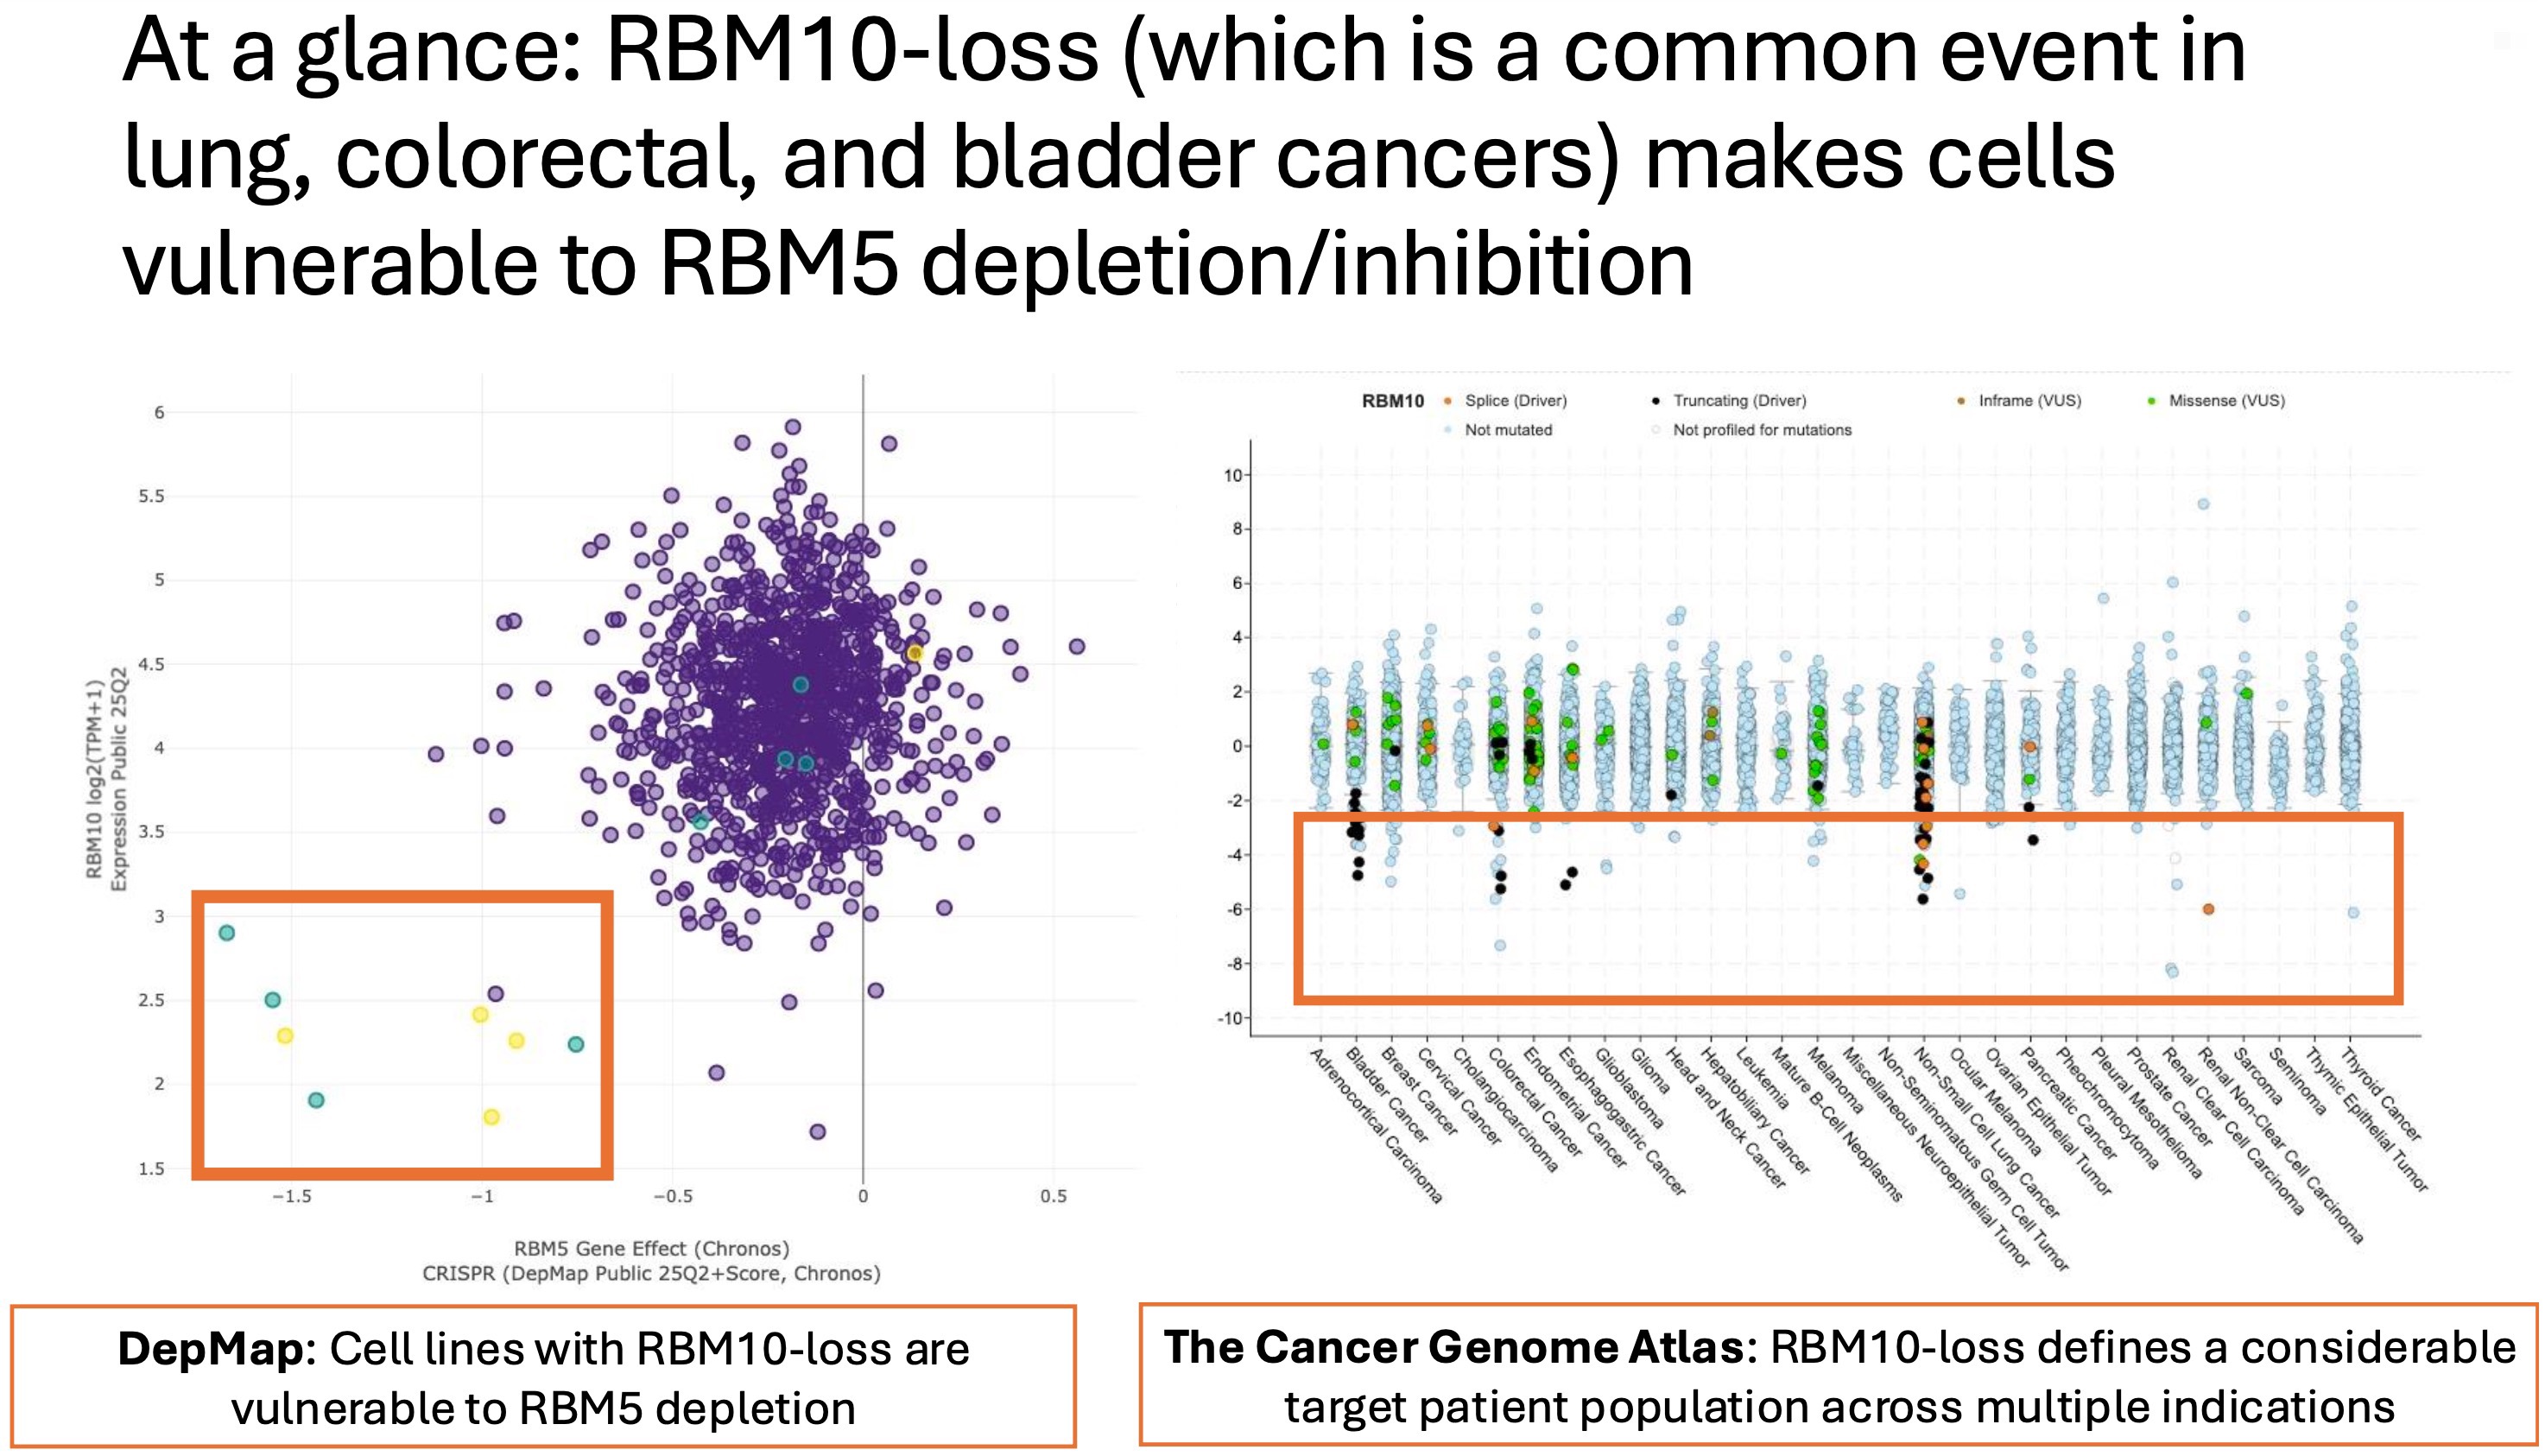
Rather than behaving like a classic synthetic lethal partner, RBM5 fits the pattern of a compensatory node that becomes essential only after the system has been pushed into a rewired state. In normal-like RPE cells, loss of RBM5 is tolerated and even associated with a proliferative advantage. In contrast, in RBM10-deficient cancer cells, RBM5 appears to sit at a point of fragility. If this interpretation is correct, disrupting RBM5 in an RBM10-loss context does not simply remove redundancy, but instead pushes an already stressed regulatory system past its tolerance threshold, producing a kill signal consistent with activation lethality.
At this point, caution is warranted. Many vulnerabilities identified in cell lines turn out to be rare or clinically irrelevant once patient genomics are considered. This is where the RBM5 story becomes more interesting. RBM10 loss is not a rare event. It is recurrent across multiple tumor types, including non-small cell lung cancer, colorectal cancer, bladder cancer, and renal cancer. Moreover, RBM10 loss has been shown to promote EGFR-driven lung cancer, indicating that this alteration is selected for and functionally relevant rather than a neutral passenger event.
That context matters. It suggests that the genomic background required for this potential activation lethality is present in real patient populations.
At the same time, directly targeting a spliceosomal regulator is inherently risky. Disrupting RBM5 globally would likely perturb core RNA-processing programs in normal cells, and as we know, RBM5 loss is associated with increased proliferation in RPE cells. However, this does not mean the biology is untargetable.
RBM5 is known to tune alternative splicing of apoptosis and stress-response transcripts, including FAS/CD95 and CASP2, by interfering with late splice-site pairing. RBM5 also counterbalances RBM10 activity at key exons such as NUMB exon 9, a regulator of NOTCH signaling. In turn, RBM10 down-regulates RBM5 through alternative splicing coupled to nonsense-mediated decay, linking their dosages. Together, these observations suggest that RBM10 loss reshapes a specific splicing landscape rather than creating a generic dependence on splicing itself.
This raises the possibility that therapeutic intervention may not require direct inhibition of RBM5. Instead, it may be possible to identify downstream transcripts or splice isoforms that are aberrantly regulated and uniquely required in RBM10-loss contexts, and to target those vulnerabilities using alternative modalities.
Closing: Looking at DepMap from the other side
Most analyses of functional genomics data are optimized to find the obvious signals: strong dependencies, clean synthetic lethalities, and genes whose loss is catastrophic. That approach has been extraordinarily productive, and it should remain the default.
But datasets like DepMap are rich enough to reward curiosity in other directions. Sometimes, by looking at what helps cells grow rather than what hurts them, we can surface growth brakes, compensatory states, and fragile rewired systems that would otherwise remain invisible. There are not many such leads, and most will not survive scrutiny. But a few do, and they often point to biology that sits just outside the standard playbook.
The Upside Down of DepMap is not a replacement for conventional analysis. It is a reminder that complex systems rarely advertise their weaknesses directly. Sometimes, the most interesting vulnerabilities are hiding in plain sight, waiting for someone to look at the data from an unusual angle.