Vibe researching: Making sense of DepMap's extreme responders via GPT 5 Pro
Akin to vibe coding, vibe researching is a modern approach to learning where you use LLMs to dive into a topic by prompting, exploring, and iterating—essentially ‘vibing’ your way through the research while the AI handles the deep reading and connects the dots for you.
Let’s imagine you are casually exploring DepMap and run into this strange and challenging profile:
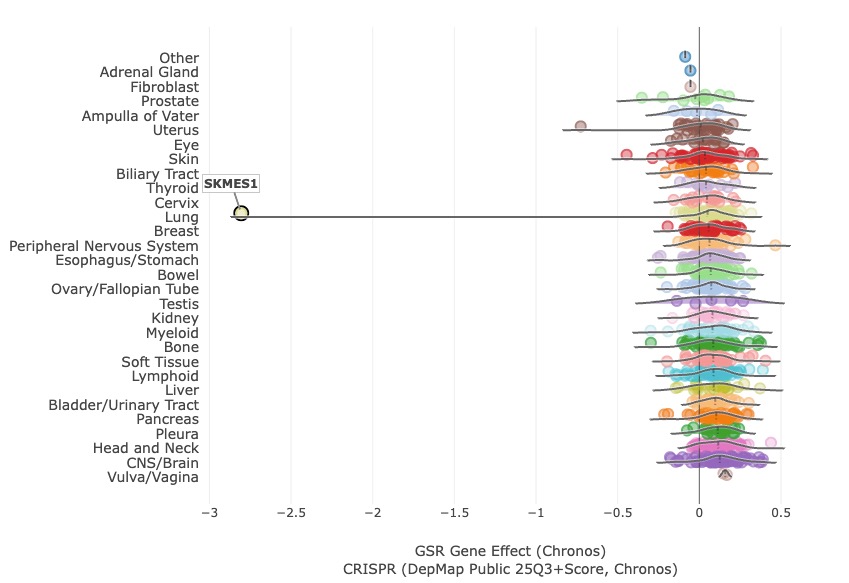
What is unusual here is that almost all cell lines show a neutral response when GSR is depleted via CRISPR KO, yet this single cancer cell line, called SK-MES-1, shows extreme sensitivity. The hard part is that this is an n=1 case, which limits what you can do with standard machine-learning comparisons (e.g., genomic differences across responders vs. non-responders). Because of that, these types of outliers are in the data are often ignored.
I love digging into these phenotypes, and, in the past, I spent hours, days, sometimes weeks dissecting multimodal data and combing through the literature on a cell line or gene. This is especially fun when you actually have the time (e.g. as part of graduate studies) or if this is part of a formal early-discovery effort (i.e. you get paid for it). One such deep dive during my PhD eventually became a preprint on an obscure oncogenic DICER1 mutation seen across a handful of patients. However, most of these explorations end up revealing a sample or data issue. Maybe 2 out of 10 point toward a pathway but stop short of a clear explanation. And if I get lucky, 1 out of 10 leads to a meaningful reason behind the extreme result, only to be dismissed as non-generalizable or in need of experimental follow-up. So these deep dives rarely end up as publications, and this is exactly why I wanted to start this blog originally.
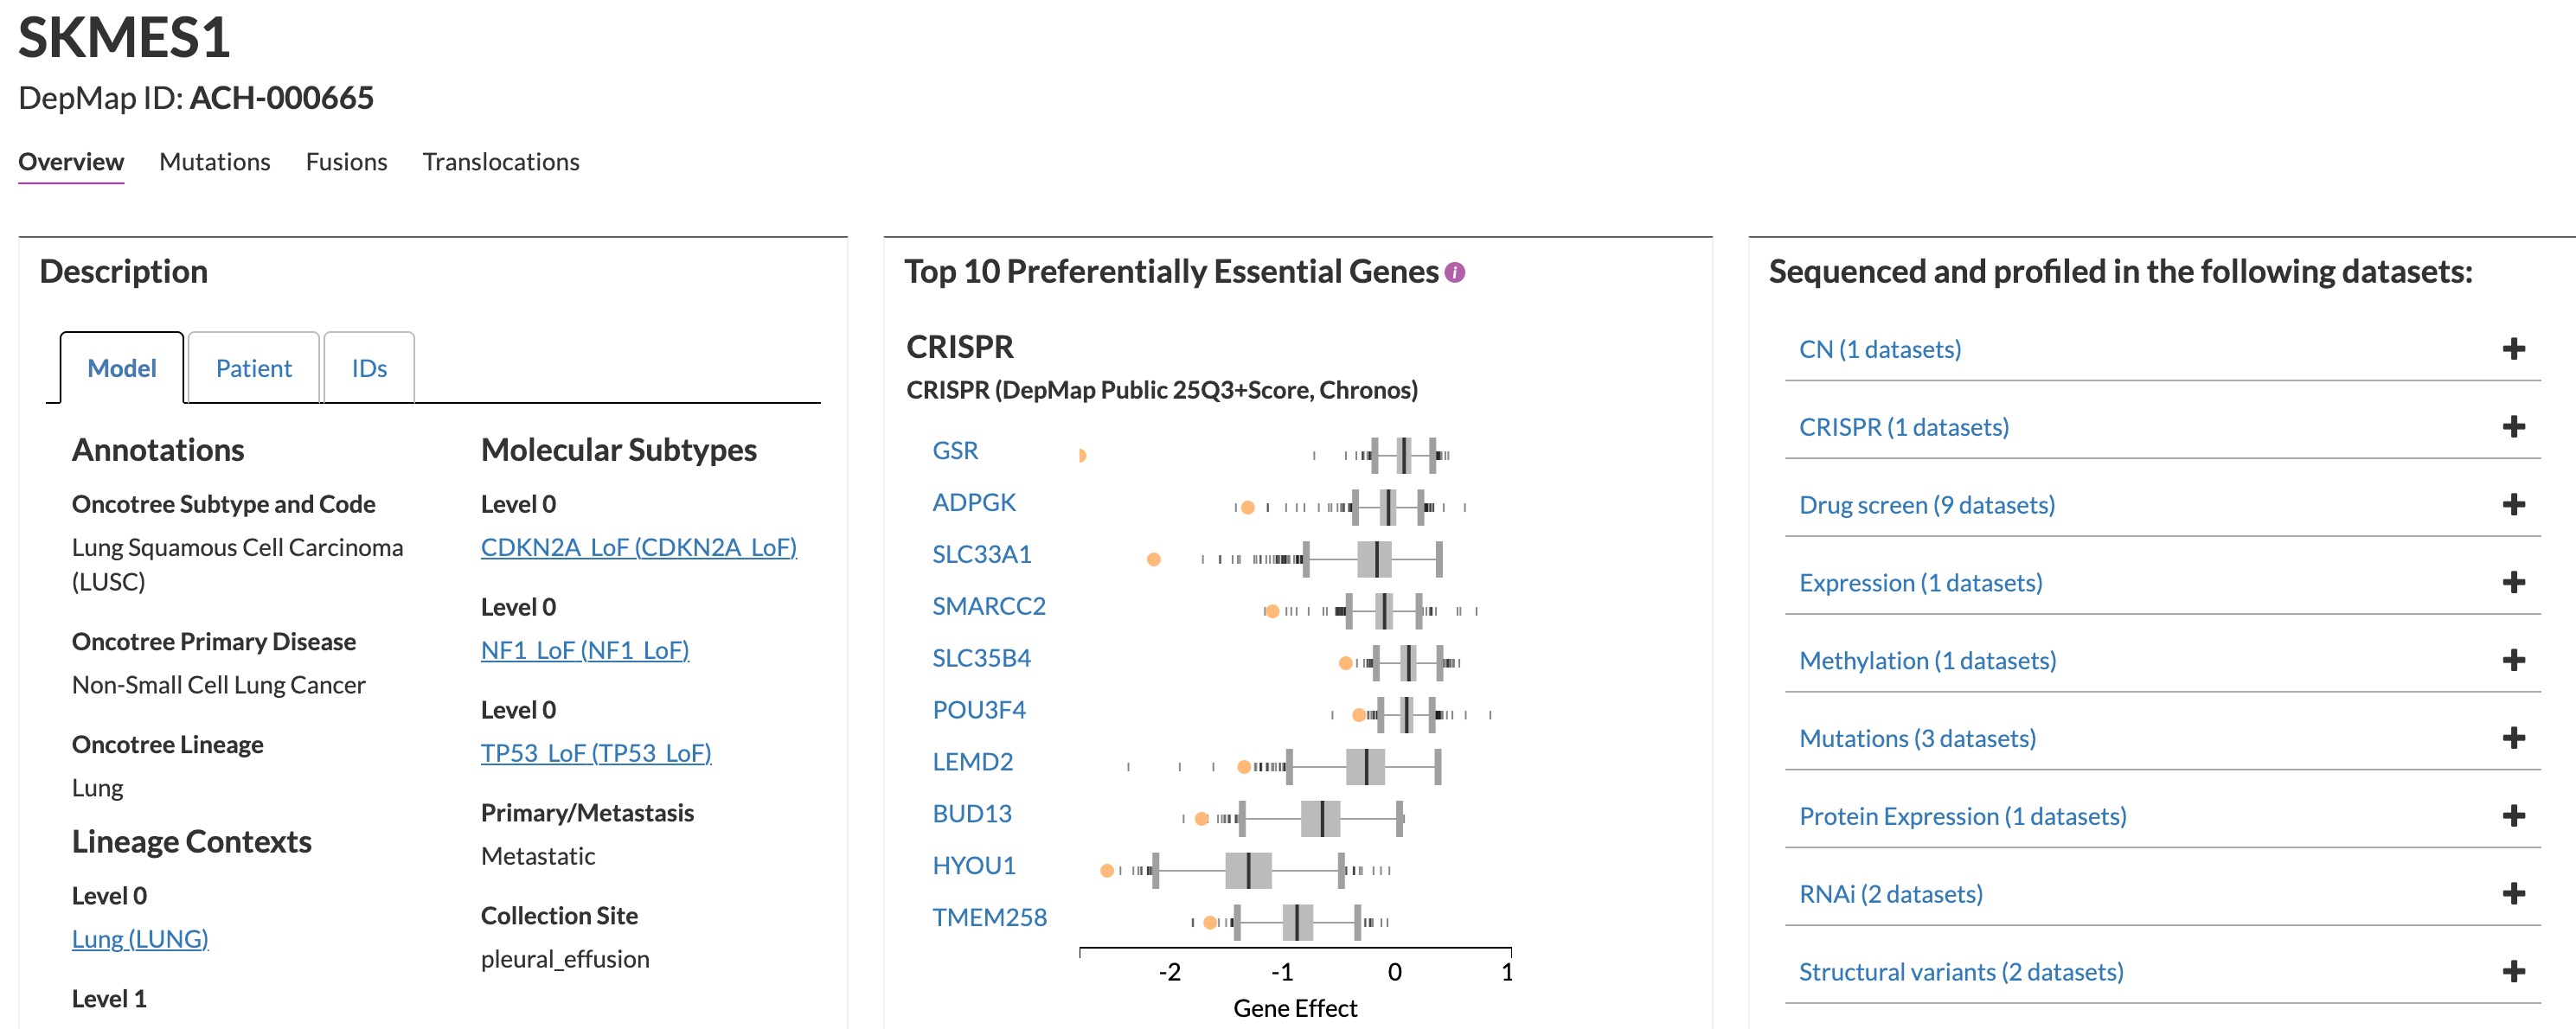
Back to SK-MES-1 and its extreme dependency on GSR (Glutathione Disulfide Reductase): I had never encountered this cell line or gene before, so the biology felt like a blank slate. I suspected there was a specific genetic context—maybe a mutation, CNV, or fusion—hidden somewhere on this page:
I have been using and experimenting with deep-research utilities since their early days, but until recently we didn’t have a reliable API to run them at scale. Submitting one request at a time through a web interface—with strict rate limits—just wasn’t workable. Now, with gpt-5-pro exposed through OpenAI’s API (and alternatives like Parallel.io), I decided to build a prompt template. After some trial and error, I settled on this:
A cancer cell line, called {cell_line_name}, is extremely sensitive to gene {gene} depletion via CRISPR-KO. Top 10 major dependencies for this cell line are: {top10deps}.
Here are the mutations identified in this cell line: {mutation_table}
Based on these, can you help me understand why {cell_line_name} might be super sensitive to {gene} depletion? Use markdown when you are answering and make sure you keep the references in.
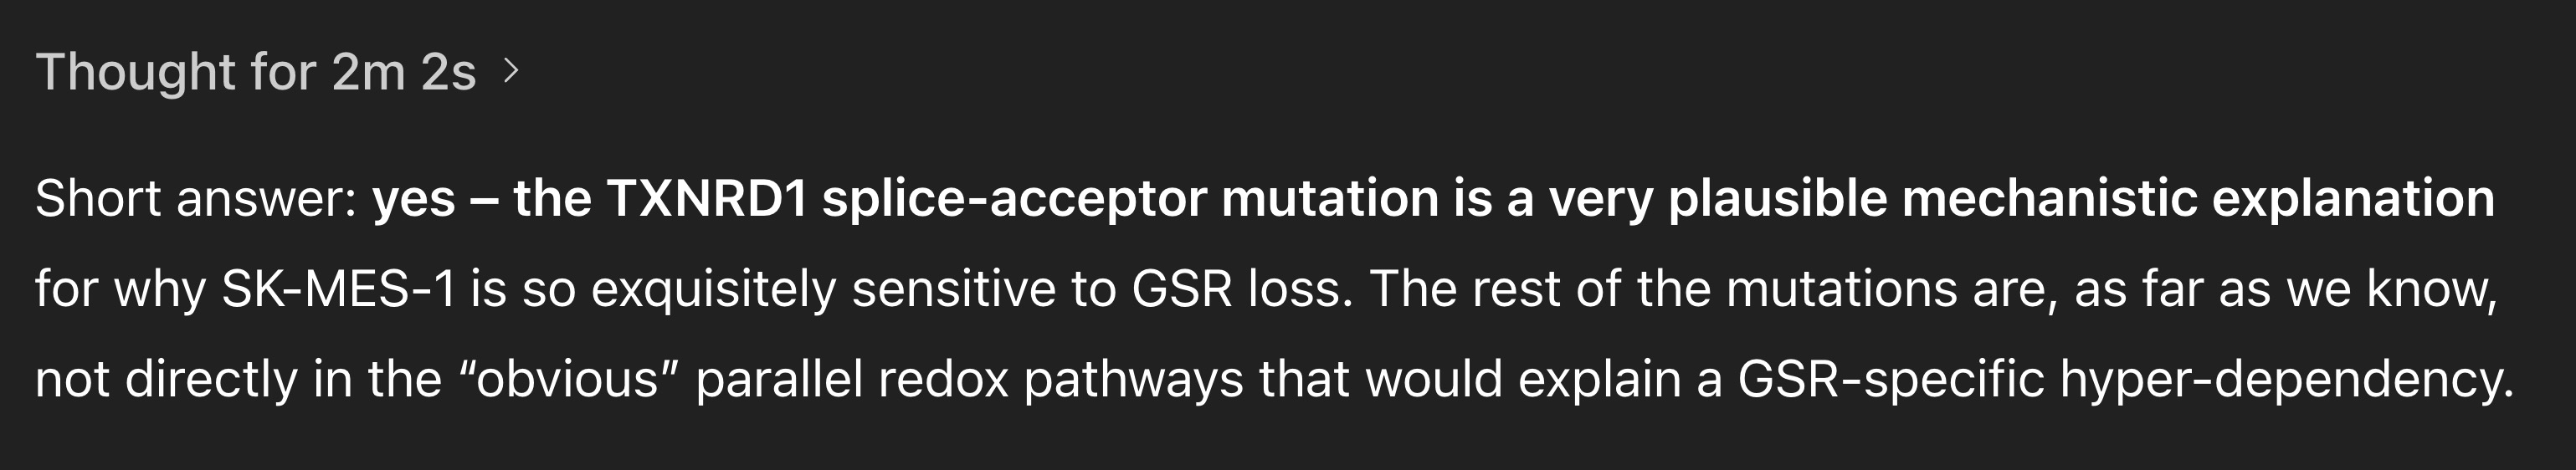
To my surprise, it took less than three minutes for GPT-5-Thinking to identify the synthetic-lethality relationship out of the 426 mutations included:
and here is the part of the response that goes into detail:
…
1. The key hit: TXNRD1 splice-acceptor variant
From your list:
TXNRD1 – SNV, splice_acceptor_variant
TXNRD1 encodes thioredoxin reductase 1, the central reductase for the cytosolic thioredoxin system. Together with GSR, it makes up one of two major, partially redundant disulfide-reducing antioxidant systems:
- GSR → keeps glutathione (GSSG → 2 GSH) reduced
- TXNRD1 → keeps thioredoxin reduced (TXN–S₂ → TXN–(SH)₂)
These two pathways are Nrf2-regulated and function as parallel antioxidant systems in mammalian cells (Distinct roles for the thioredoxin and glutathione antioxidant systems …). Multiple studies have emphasized that TXNRD1 and GSR are functionally paired disulfide reductases, and that simultaneous inhibition of both is catastrophic for tumor cells (Characterization of a small molecule inhibitor of disulfide reductases …).
Key points:
- Splice-acceptor variants at canonical intron–exon boundaries are usually loss-of-function (exon skipping / intron retention → frameshift → NMD).
- If this TXNRD1 variant affects the main coding isoform, you effectively cripple the thioredoxin system in that cell line.
- In that context, the cell is forced to lean heavily on GSR + GSH for redox homeostasis.
There is good in vivo and in vitro evidence that:
- When glutathione is depleted, cells up-regulate or depend more on TXNRD1, and vice versa – if TXNRD1 is lost, glutathione pathways become more critical (A Redundant System of Thioredoxin and Glutathione Is Essential for …).
- Combined inhibition or loss of both GSR and TXNRD1 drives strong oxidative stress and cancer cell death (synthetic-lethal-like behavior) (Inhibition of Thioredoxin/Thioredoxin Reductase Induces Synthetic …).
…
As you can see, a thinking model with light search capabilities was able to figure this out with almost no hand-holding. Doing this manually would have taken me days to track down the weak link and build the biological case. So the obvious next question: can this scale?
To test it, I first created a simple method to identify extreme responders in DepMap. Here are the top 20:
| Cell line | Model ID | Gene | Gene CNV | Chronos | Mean Chronos |
|---|---|---|---|---|---|
| SKMES1 | ACH-000665 | GSR | 0.689901355 | -2.805081015 | 0.073210444 |
| NCIH209 | ACH-000290 | SOX1 | 0.900322013 | -2.330362872 | 0.107062906 |
| HCC1395 | ACH-000699 | TXNL1 | 2.231122922 | -2.212720497 | -0.1103986 |
| TF1 | ACH-000387 | ETV6 | 0.91171322 | -2.164286582 | -0.021010812 |
| OS384 | ACH-002834 | SNAI2 | 1.434246503 | -2.113822951 | -0.112583652 |
| MM100511 | ACH-002928 | BRAP | 0.747675415 | -1.978243035 | -0.255199889 |
| EKVX | ACH-000706 | PTDSS2 | 1.103052914 | -1.908065998 | 0.073134 |
| NCIH526 | ACH-000767 | POU2AF2 | 2.536360826 | -1.904726778 | -0.00494779 |
| SNU61 | ACH-000532 | RB1CC1 | 0.707031795 | -1.885705392 | -0.218159067 |
| NIHOVCAR3 | ACH-000001 | FZR1 | 0.633707063 | -1.86360478 | -0.209452144 |
| NCIH157DM | ACH-000921 | ARIH2 | 1.084756326 | -1.852461427 | 0.054123191 |
| ZR751 | ACH-000097 | ASH1L | 2.006109006 | -1.787887575 | -0.184052968 |
| K562 | ACH-000551 | MPPE1 | 1.055502649 | -1.764917658 | -0.234663579 |
| RVH421 | ACH-000614 | MAP2K2 | 0.997987991 | -1.760457331 | -0.182393707 |
| RPMI2650 | ACH-001385 | NUTM1 | 0.985643955 | -1.74866448 | 0.000816 |
| SUPT1 | ACH-000953 | MAPK14 | 1.189205466 | -1.742065213 | -0.174483211 |
| UPCISCC090 | ACH-001227 | FOXE1 | 17.60251906 | -1.727963974 | -0.008935922 |
| SF539 | ACH-000273 | SPNS1 | 1.223737395 | -1.727528681 | -0.283174905 |
| FADU | ACH-000846 | C7orf25 | 1.306437402 | -1.720953978 | 0.038562097 |
| SNU739 | ACH-002523 | KDELR2 | 1.27255058 | -1.720720464 | -0.076599961 |
I then pulled the top 10 dependencies for each cell line and their mutations; generated the prompts; submitted them programmatically to gpt-5-pro; collected the full responses; and summarized them via gpt-5-nano.
Each gpt-5-pro run took 5–10 minutes and cost about $7. I ran 10 tasks in parallel, so processing 20 extreme responders took ~30 minutes. The total cost, including summarization, was around $150. For what amounts to twenty literature deep dives, this is wild. There is simply no way I could do that manually in half an hour. And yes, there were interesting results. Here are a few highlights:
SKMES1 is an extreme responder to GSR depletion because SK-MES-1 relies almost entirely on the glutathione system because its alternative thioredoxin pathway is crippled by a TXNRD1 splice-acceptor mutation, leaving GSR as the essential antioxidant relay. In other words, the thioredoxin reductase arm is nonfunctional, so loss of GSR eliminates the remaining two-electron reductive capacity. GSR KO would drive GSSG accumulation and widespread protein thiol oxidation, tipping the ER and cytosol toward oxidative damage. The ER is already under heavy proteostasis/oxidative‑folding stress in this cell line, as indicated by dependencies on HYOU1, TMEM258, SLC33A1, and SLC35B4, and a PRKCSH nonsense mutation further strains glycoprotein folding. Mutations that compromise GSH handling (ABCC1 nonsense) and mitochondrial redox buffering (SLC25A24 nonsense) further increase sensitivity, since they reduce GSSG export and mitochondrial ROS buffering. Taken together, these features converge on GSR as the single point of failure for maintaining a reduced GSH pool and a viable redox environment.
EKVX is an extreme responder to PTDSS2 depletion because of the paralog synthetic lethality stemming from a truncating PTDSS1 mutation. PTDSS1 and PTDSS2 are the two PS synthases in mammalian cells; either can sustain de novo PS production, but losing both is incompatible with survival. With PTDSS1 function truncated, EKVX must rely on PTDSS2; knocking out PTDSS2 collapses PS biosynthesis and kills the cells. The strong co-dependencies on SELENOI and TMEM258 fit this model: SELENOI supplies PE for PS synthesis, and TMEM258 ties ER function and stress responses to PS flux. This pattern is the classic paralog-based synthetic-lethal logic and matches the data for EKVX. The NSCLC origin of EKVX within the NCI-60 panel is a realistic context for lipid-metabolic rewiring that could reveal such a bottleneck.
UPCISCC090 is an extreme responder to FOXE1 depletion because UPCISCC090 has HPV16-driven focal amplifications that include FOXE1, creating a lineage-transcription factor addiction in a keratinocyte/HNSCC context. The HPV integration events flank these amplifications, and the FOXE1 copy number is about sevenfold, which can make FOXE1 essential for survival when perturbed. FOXE1 is a direct GLI2 target in basal keratinocytes and can drive EMT programs through ZEB1, and this particular line also carries a GLI2 missense variant that could tune that axis. Together, the HPV-driven FOXE1 amplification and the Hedgehog/GLI context likely render the cell highly FOXE1-dependent. The broader HPV+ HNSCC wiring—E6–UBE3A, PSMD10/gankyrin, PIM1 amplification, and SOX2 lineage reliance—helps sustain a transcriptional and proteostasis state that becomes brittle when a key amplified TF is removed. In short, a combination of local FOXE1 amplification and keratinocyte lineage signaling best explains the extreme sensitivity to FOXE1 knockout.
RPMI2650 is an extreme responder to NUTM1 depletion because RPMI-2650 is driven by a BRD4–NUTM1 fusion, and NUTM1 knockout removes the fusion oncoprotein, collapsing the megadomain-driven chromatin state and transcription program that the fusion creates. Without this program, cells rapidly differentiate toward a squamous lineage and stop growing, which explains the observed growth arrest. This represents a fusion-specific oncogene addiction rather than a general requirement for NUTM1 in somatic cells. The BRD4–NUTM1 ex15:ex2 configuration in RPMI‑2650 is documented, reinforcing its classification as a NUT carcinoma–type dependency. BET inhibitors or p300/CBP inhibitors phenocopy this effect, supporting the link between the fusion-driven transcriptional state and sensitivity to disruption. CERES-corrected CRISPR data further argue that this is a true dependency rather than a copy-number artifact.
There are ~60 more extreme responders (each a one-cell-line, one-gene story) still to go through, and there’s even more to explore: two cell lines sharing the same extreme response, one cell line showing extreme responses across multiple genes, etc. More on that soon. In the meantime, all code, prompts, responses, and summaries are available at
armish/vibe-researching/depmap-extreme_responders.